UK House Price Index Wales: March 2017
Published 16 May 2017
Applies to Wales

漏 Crown copyright 2017
This publication is licensed under the terms of the Open Government Licence v3.0 except where otherwise stated. To view this licence, visit or write to the Information Policy Team, The National Archives, Kew, London TW9 4DU, or email: psi@nationalarchives.gov.uk.
Where we have identified any third party copyright information you will need to obtain permission from the copyright holders concerned.
This publication is available at /government/statistics/uk-house-price-index-wales-march-2017/uk-house-price-index-wales-march-2017
1. Headline statistics for March 2017
the average price of a property in Wales was
拢147,746
the annual price change of a property for Wales was
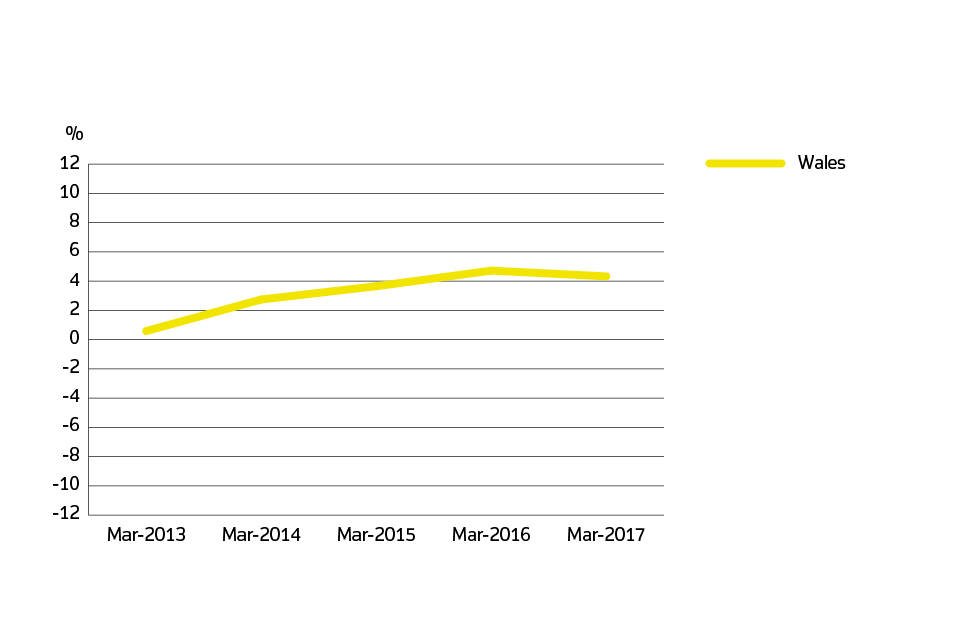
4.3%
the monthly price change of a property for Wales was
1.4%
the index figure for Wales (January 2015 = 100) was
108.5
Estimates for the most recent months are provisional and are likely to be updated as more data is incorporated into the index. Read the revision policies.
2. Price change
2.1 Annual price change
Annual price change for Wales over the past 5 years
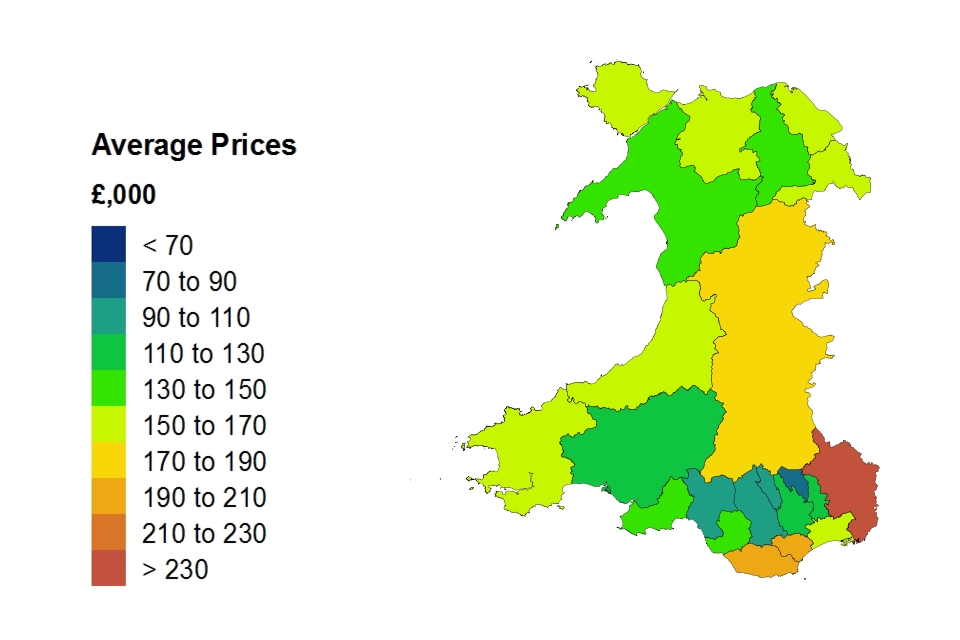
Annual price change by local authority for Wales
| Local authorities | March 2017 | March 2016 | Difference |
|---|---|---|---|
| Blaenau Gwent | 拢76,964 | 拢77,365 | -0.5% |
| Bridgend | 拢141,772 | 拢132,105 | 7.3% |
| Caerphilly | 拢120,212 | 拢115,124 | 4.4% |
| Cardiff | 拢192,482 | 拢190,241 | 1.2% |
| Carmarthenshire | 拢128,918 | 拢124,904 | 3.2% |
| Ceredigion | 拢167,359 | 拢169,710 | -1.4% |
| Conwy | 拢152,010 | 拢143,304 | 6.1% |
| Denbighshire | 拢140,549 | 拢139,052 | 1.1% |
| Flintshire | 拢154,780 | 拢151,801 | 2.0% |
| Gwynedd | 拢144,450 | 拢147,291 | -1.9% |
| Isle of Anglesey | 拢159,497 | 拢163,696 | -2.6% |
| Merthyr Tydfil | 拢98,545 | 拢87,715 | 12.3% |
| Monmouthshire | 拢232,652 | 拢219,651 | 5.9% |
| Neath Port Talbot | 拢106,909 | 拢102,284 | 4.5% |
| Newport | 拢156,189 | 拢143,219 | 9.1% |
| Pembrokeshire | 拢163,006 | 拢162,434 | 0.4% |
| Powys | 拢173,114 | 拢165,311 | 4.7% |
| Rhondda Cynon Taf | 拢101,546 | 拢98,148 | 3.5% |
| Swansea | 拢138,928 | 拢134,931 | 3.0% |
| Torfaen | 拢129,541 | 拢122,073 | 6.1% |
| Vale of Glamorgan | 拢207,535 | 拢192,302 | 7.9% |
| Wrexham | 拢153,352 | 拢141,323 | 8.5% |
| Wales | 拢147,746 | 拢141,617 | 4.3% |
Average price by local authority for Wales
2.2 Average price change by property type
Average price change by property type for Wales
| Property type | March 2017 | March 2016 | Difference |
|---|---|---|---|
| Detached | 拢219,943 | 拢213,809 | 2.9% |
| Semi-detached | 拢142,584 | 拢135,451 | 5.3% |
| Terraced | 拢114,798 | 拢109,711 | 4.6% |
| Flat or maisonette | 拢108,864 | 拢103,462 | 5.2% |
| All | 拢147,746 | 拢141,617 | 4.3% |
3. Sales volumes
Due to a period of 2 to 8 weeks between completion and registration of sales, volume figures for the most recent two months are not yet complete, so they are not included in the report.
3.1 Sales volumes by local authority
Sales volumes for Wales by Local Authority: January 2017
| Local authorities | Sales volume |
|---|---|
| Blaenau Gwent | 63 |
| Bridgend | 140 |
| Caerphilly | 132 |
| Cardiff | 314 |
| Carmarthenshire | 173 |
| Ceredigion | 69 |
| Conwy | 121 |
| Denbighshire | 73 |
| Flintshire | 145 |
| Gwynedd | 111 |
| Isle of Anglesey | 58 |
| Merthyr Tydfil | 52 |
| Monmouthshire | 93 |
| Neath Port Talbot | 110 |
| Newport | 181 |
| Pembrokeshire | 112 |
| Powys | 111 |
| Rhondda Cynon Taf | 223 |
| Swansea | 207 |
| Torfaen | 71 |
| Vale of Glamorgan | 121 |
| Wrexham | 81 |
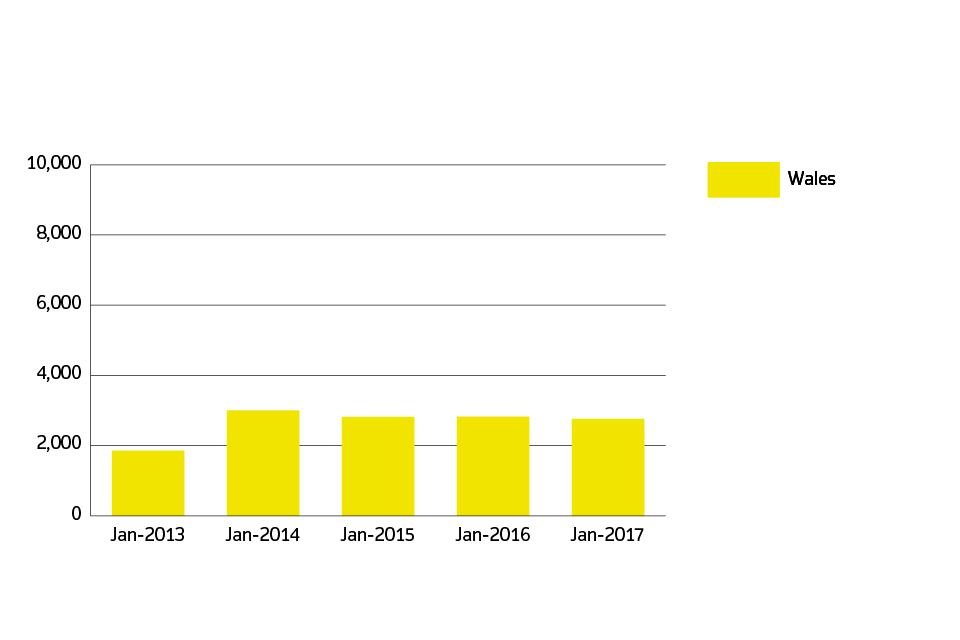
| Wales | 2,762 |
3.2 Sales volumes: January 2017
Sales volumes for Wales over the past 5 years
4. Building status
New build and existing resold property for Wales
| Property status | Average price | Monthly change | Annual change |
|---|---|---|---|
| New build | 拢194,043 | -4.4% | 13.0% |
| Existing resold property | 拢144,983 | 1.6% | 3.7% |
Note: the first estimate for new builds are based on a small sample which can cause volatility in this initial estimate.
5. Buyer status
First time buyer and former owner occupier for Wales
| Type of buyer | Average price | Monthly change | Annual change |
|---|---|---|---|
| First time buyer | 拢128,177 | 2.0% | 4.7% |
| Former owner occupier | 拢170,406 | 0.6% | 3.9% |
6. Funding status
Cash and mortgage indicator for Wales
| Funding status | Average price | Monthly change | Annual change |
|---|---|---|---|
| Cash | 拢143,766 | 1.0% | 3.5% |
| Mortgage | 拢150,107 | 1.5% | 4.8% |
7. Repossession volumes
Due to a period of 2 to 8 weeks between completion and registration of sales, repossession volume figures for the most recent two months are not yet complete, so they are not included in the report.
Repossession volumes by government office region: January 2017
| Country | Repossession sales volume |
|---|---|
| Wales | 56 |
8. About the UK House Price Index
The UK House Price Index (UK HPI) is calculated by the Office for National Statistics and Land & Property 天美影院 Northern Ireland. Find out about the to create the UK HPI.
Data for the UK House Price Index is provided by HM Land Registry, , and the Valuation Office Agency.
Find out more about the UK House Price Index.
9. Access the data
Download the data as CSV files or access it with .
10. Contact
Eileen Morrison, Data 天美影院 Team Leader, HM Land Registry
Email eileen.morrison@landregistry.gov.uk
Telephone 0300 006 5288